Stock Screener Candlestick Patterns

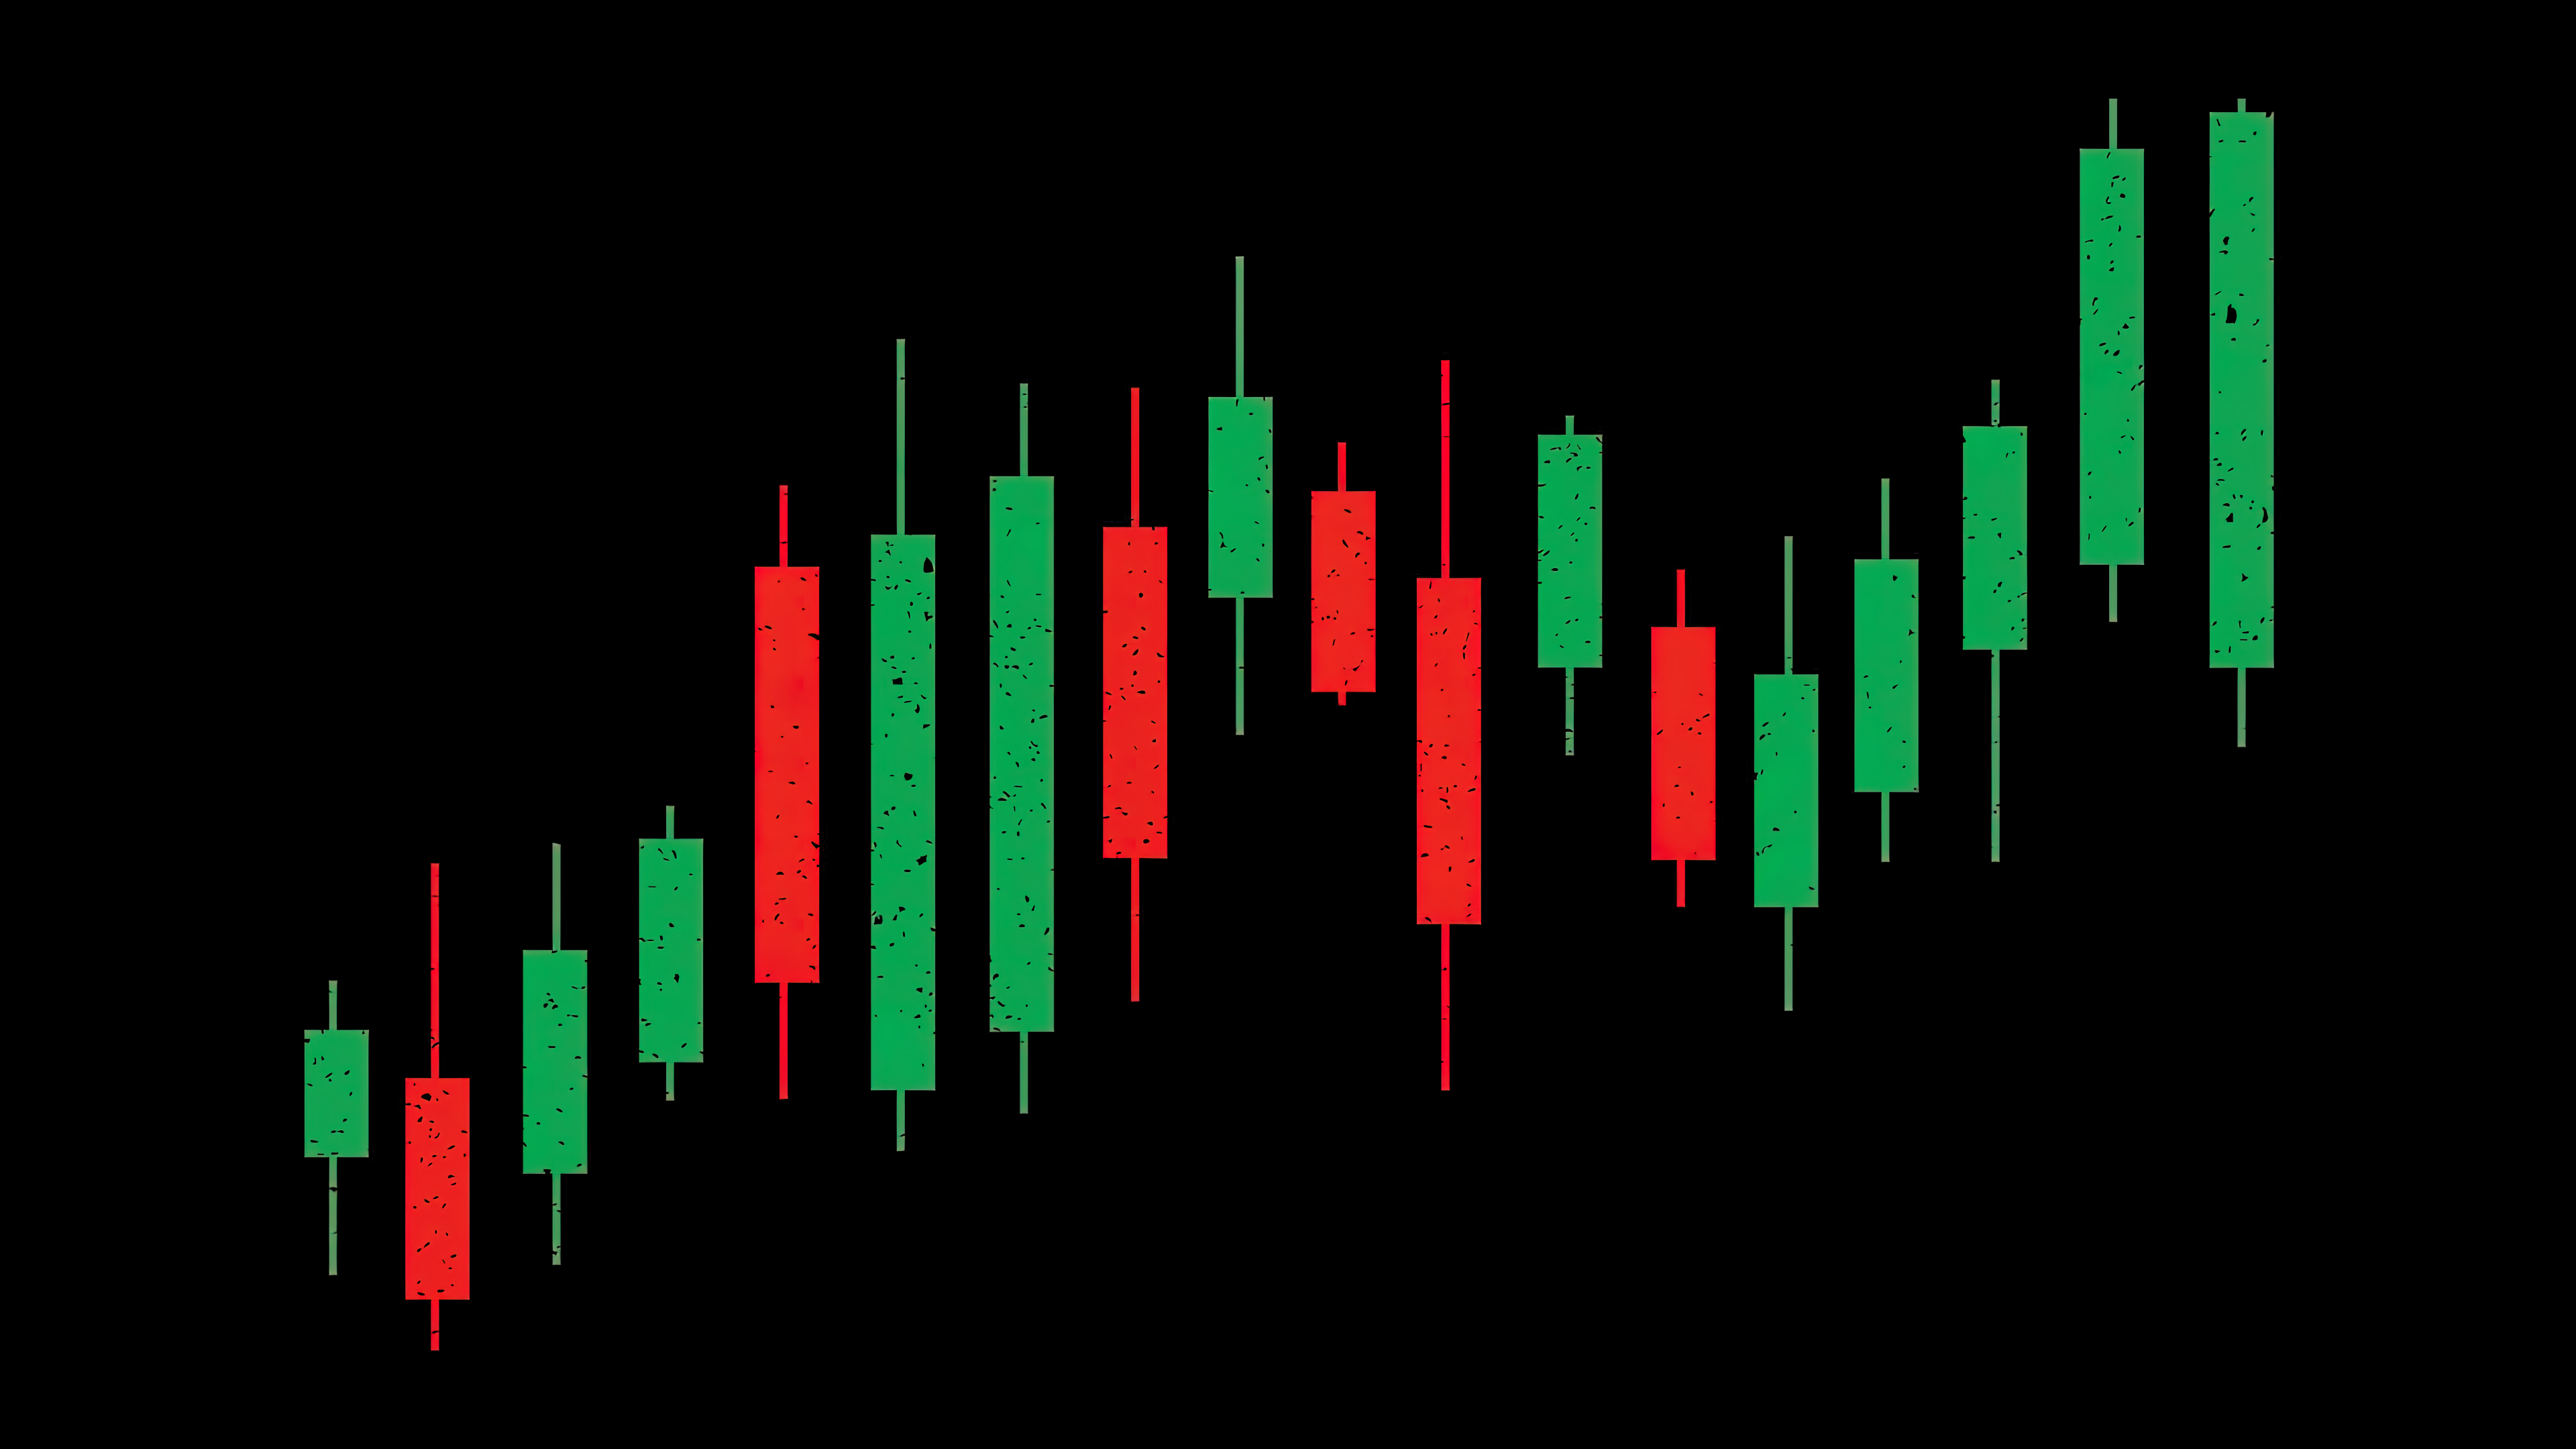
Let’s be honest: there’s a certain thrill in spotting a secret message in a sea of stock charts. It’s like being a detective, but instead of solving crimes, you’re trying to predict the next big move in the market. Stock screeners with candlestick patterns turn a boring list of numbers into a vibrant story of fear, greed, and hope.
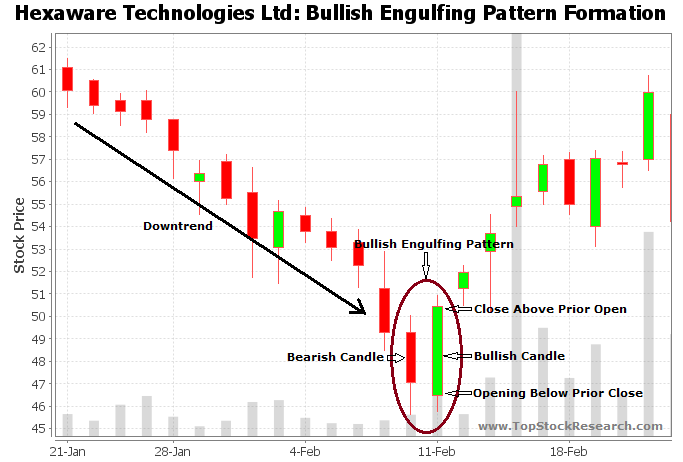
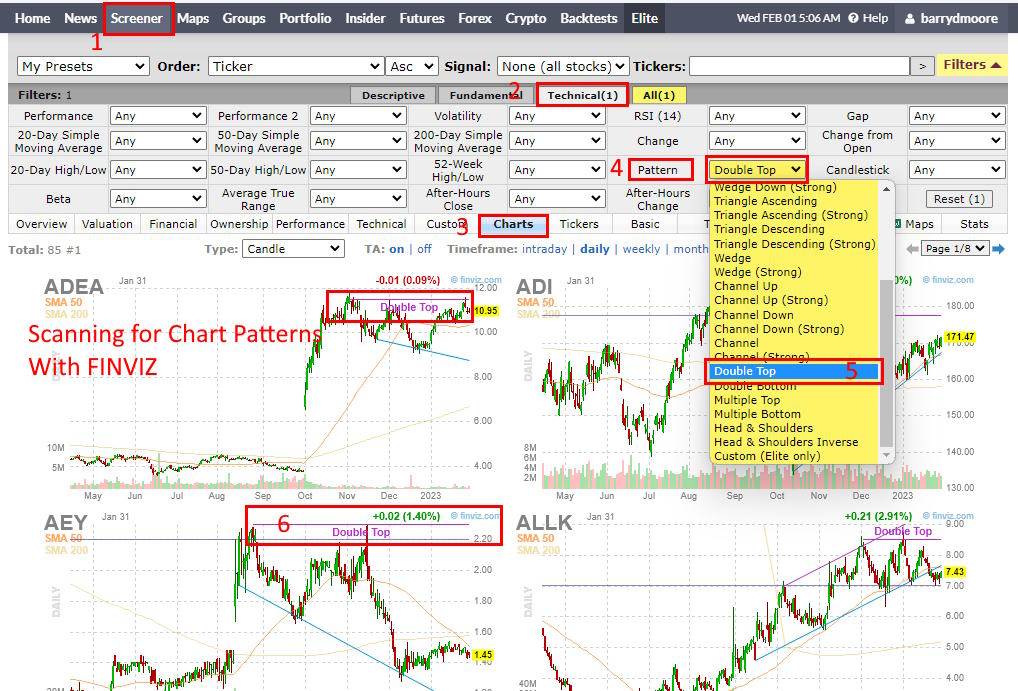
Beyond the fun, this tool is a genuine life hack for your wallet. It helps you filter through thousands of stocks in seconds, so you don’t waste hours staring at random tickers. By flagging specific patterns like a hammer or an engulfing bullish candle, it gives you a clearer entry and exit point—which is the difference between gambling and making a plan.
For everyday investors, this means less anxiety and more confidence. You’re no longer buying on a whim; you’re buying because the data suggests a shift in sentiment. It’s like having a weather forecast for the market—you still might get rained on, but at least you brought an umbrella.
Must Read
Common examples pop up in daily trading: a doji signals indecision, a morning star hints at a reversal, and a shooting star warns of a potential top. You’ll see these patterns on day-trading platforms like TradingView or Thinkorswim, but also in long-term swing trading. Even if you’re just saving for retirement, knowing a bearish pattern can help you wait for a better buy price.
To enjoy this tool more effectively, start by mixing screeners with your own common sense. Don’t just buy a stock because it shows a bullish pattern—check the overall trend and trading volume. Volume is your best friend; a pattern with low volume is a whisper, but with high volume, it’s a shout.

Another tip: don’t try to learn every pattern at once. Focus on five or six reliable ones, like the bullish marubozu or the bearish harami, and master those first. Trust me, your brain will thank you—too many patterns just lead to analysis paralysis.
Also, set your screener filters to match your time frame. If you’re a busy professional, use daily or weekly charts, not 1-minute ones that’ll make your heart race. And always, always backtest a pattern on historical data before risking real cash. It’s free practice, and it turns a hobby into a skill.

Finally, remember that candlestick patterns are probabilities, not promises. No pattern works 100% of the time, so accept small losses as part of the game. Use a screener to find the set-up, but let your stop-loss orders protect your capital.
So go ahead—fire up that screener and see what the candlesticks are whispering today. You’ll soon find that this once-daunting tool becomes a fun, addictive puzzle. And with a little practice, you’ll be reading the market’s mood like a pro, one tiny candle at a time.