Javascript Gantt Chart Drag And Drop
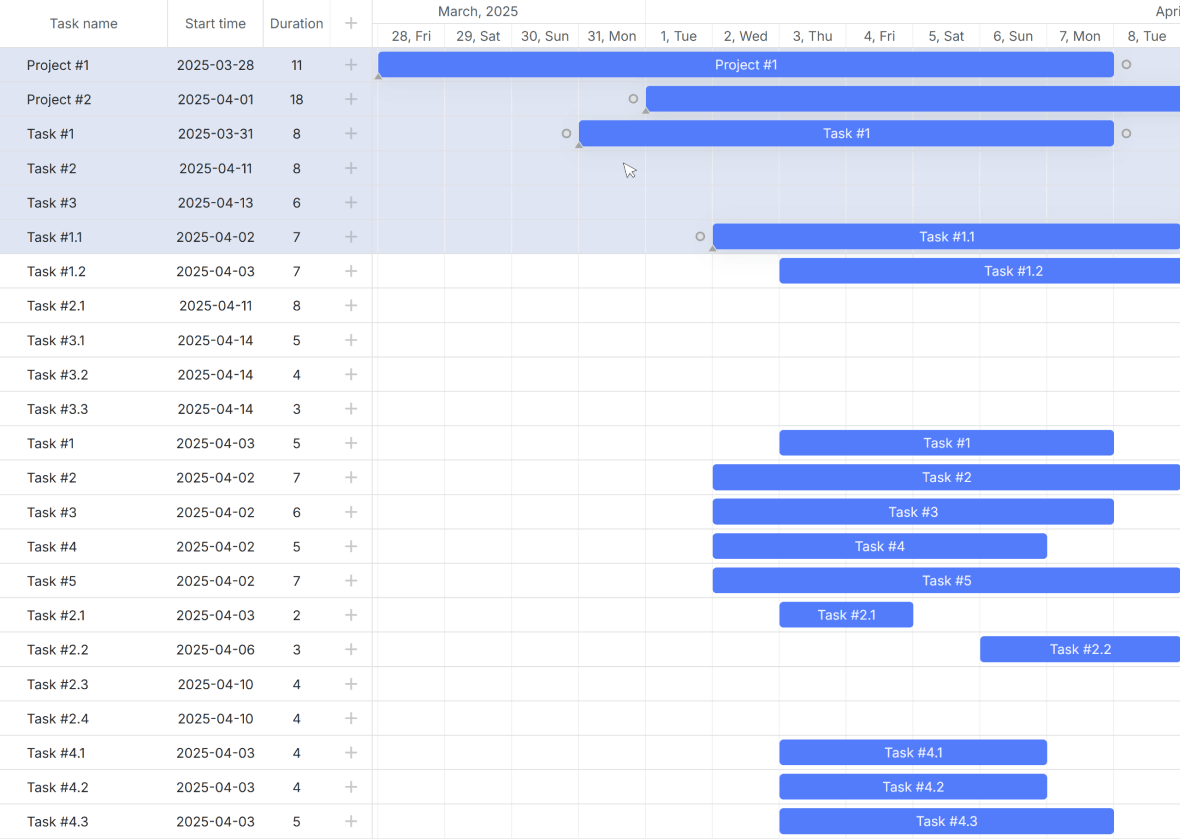
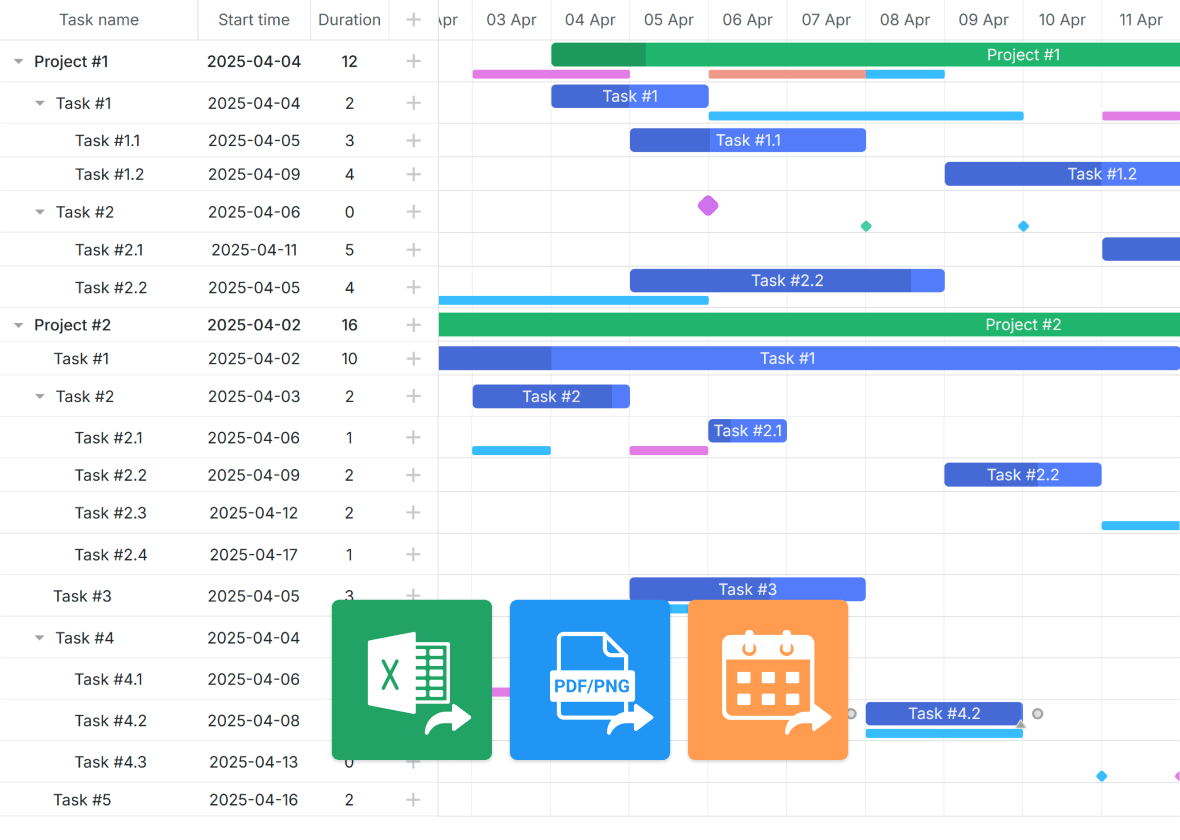
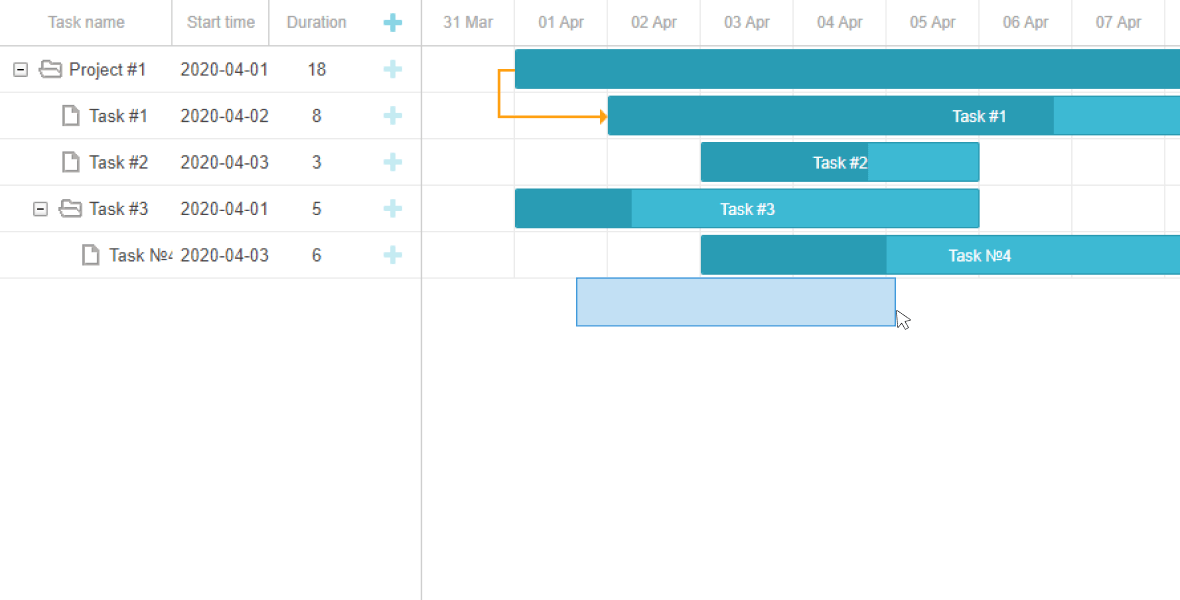
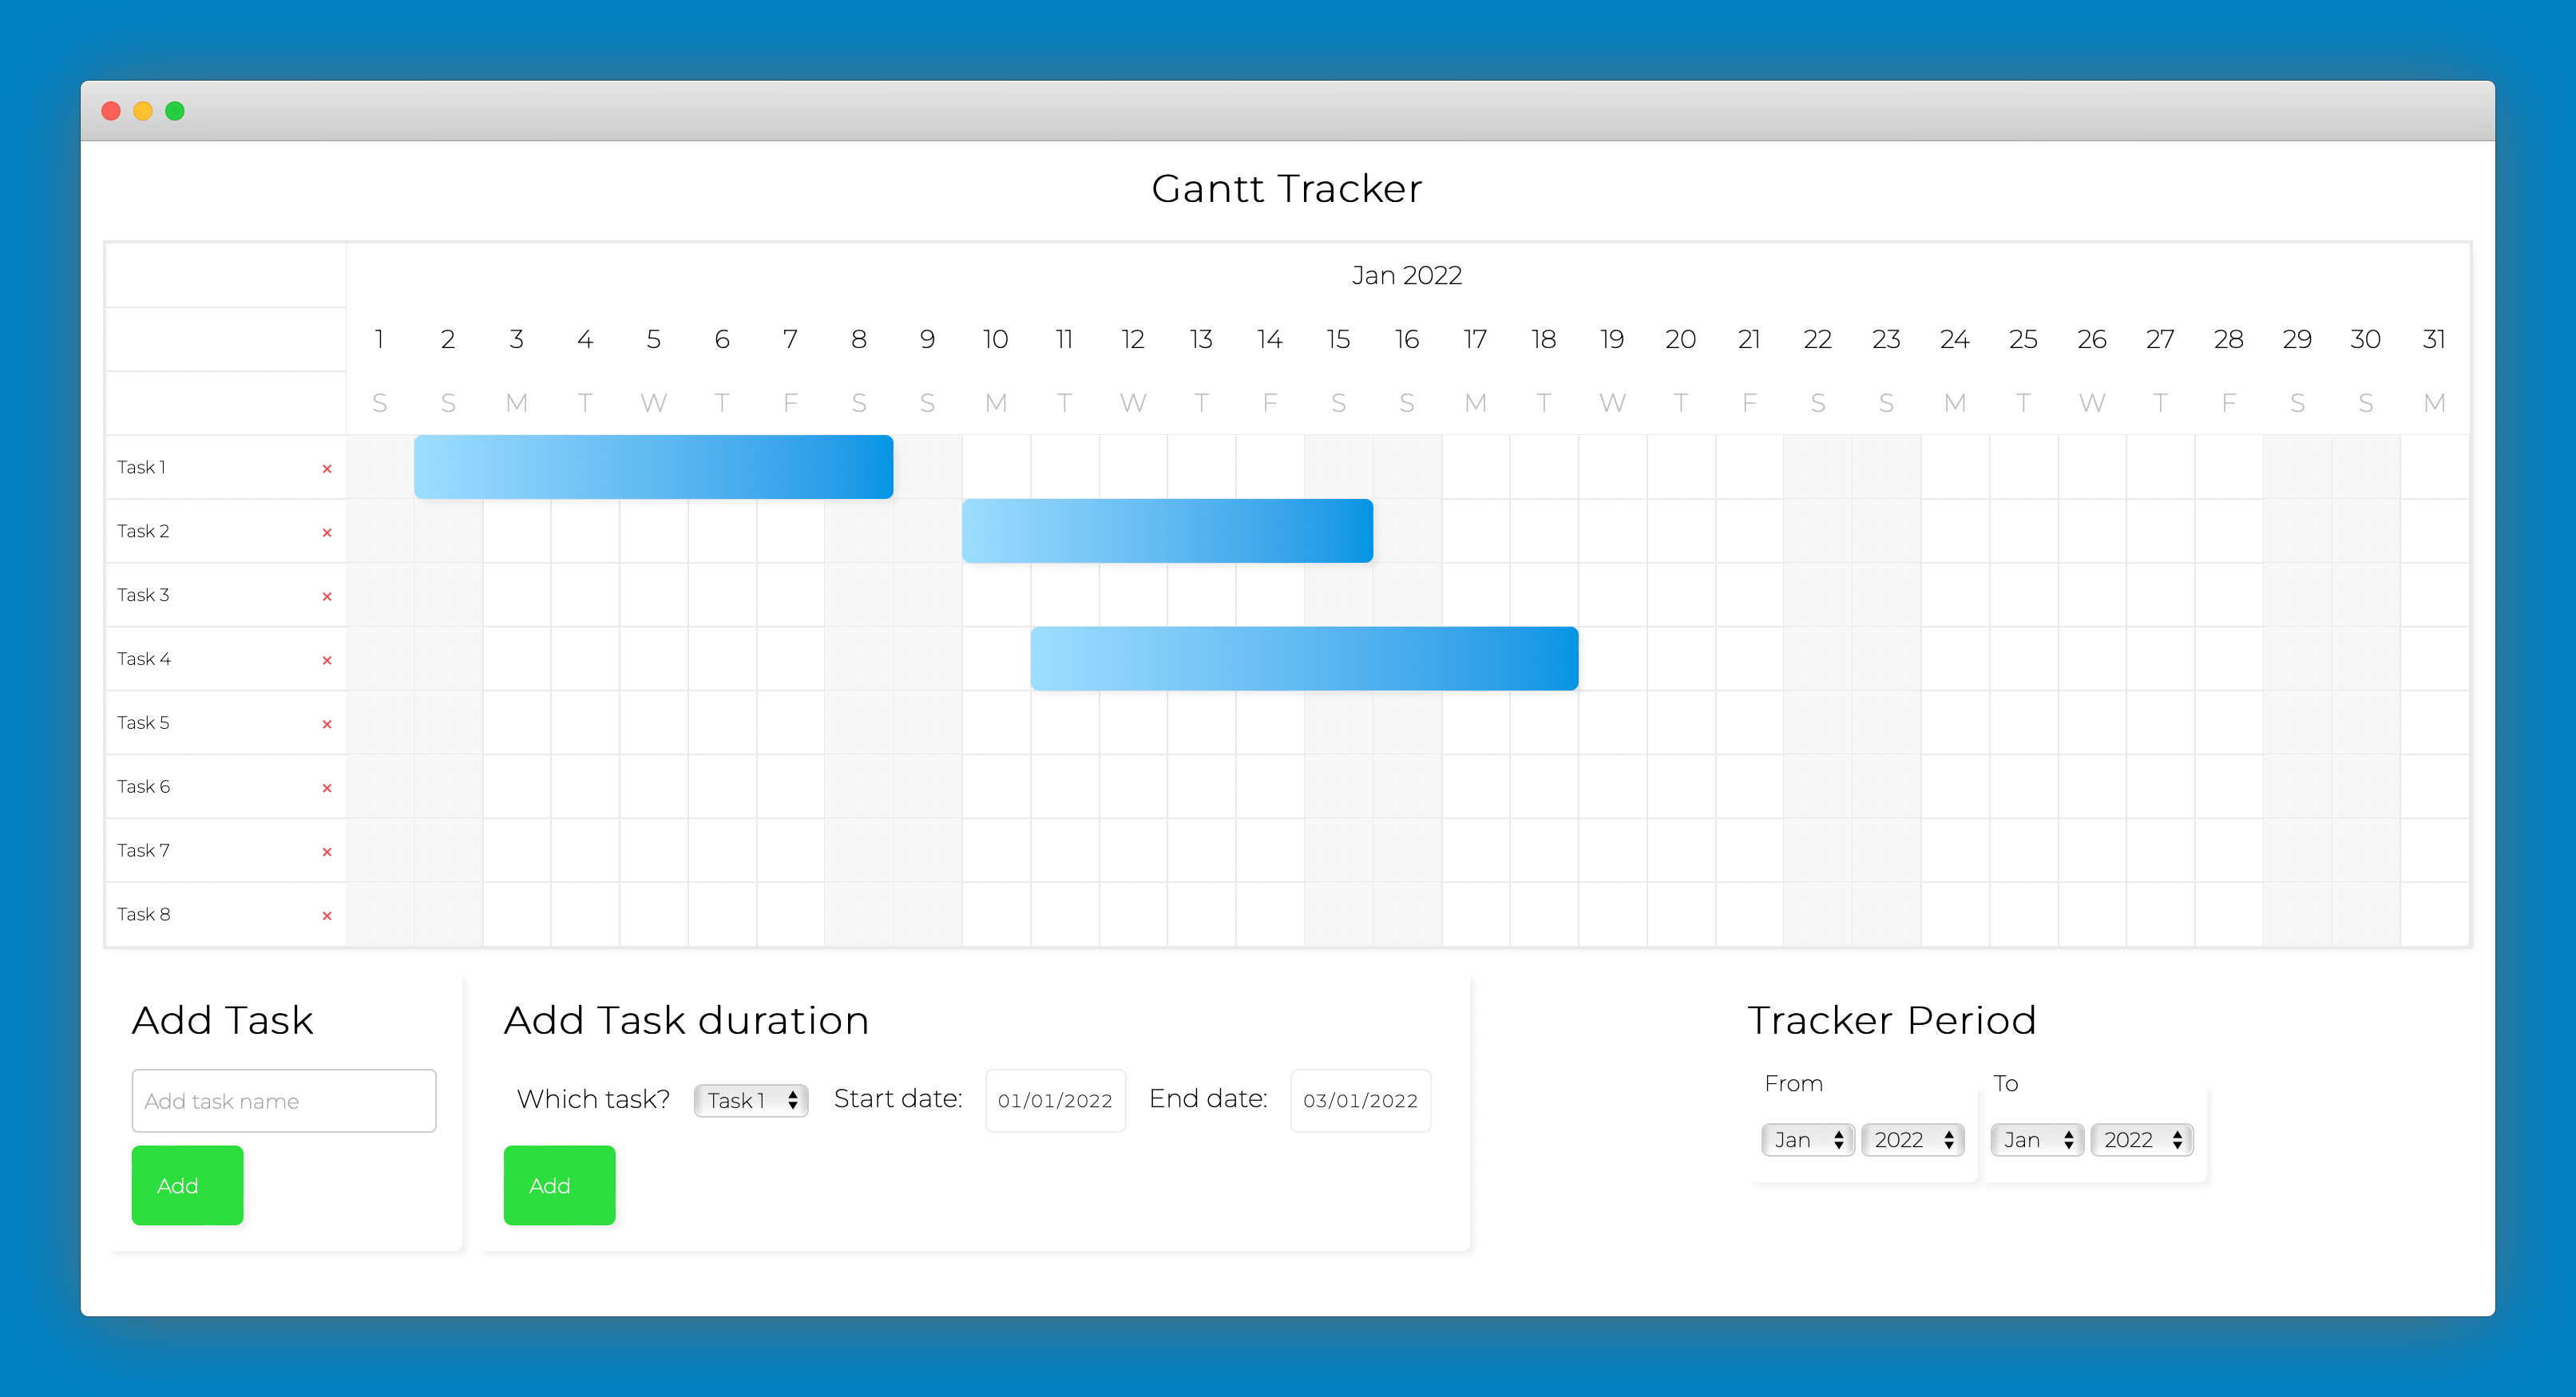
Picture this: you’re staring at a Gantt chart that looks like a very organized game of Tetris, but the pieces are all wrong. Deadlines are mockingly out of reach, and your plan resembles a sad, tangled slinky. Wouldn’t it be magical if you could just grab a task bar, drag it to a better date, and watch the whole universe (or at least your project timeline) snap into place? That, my friend, is the delightful sorcery of drag-and-drop in JavaScript Gantt charts.
Why Dragging Feels So Right
Let’s be honest: nobody wants to type a new date into a tiny input box when you can just yank a bar across the screen. It’s the difference between asking a waiter to move your table six inches and just picking up the table yourself. The visual, tactile feedback is pure dopamine for anyone who’s ever managed a project.
Implementing this isn’t just about looking cool in front of your PM. It’s about saving your sanity when priorities shift faster than a cat on a hot tin roof. The core idea is simple: listen for mouse (or touch) events, track the movement, and then update the task’s start and end dates on the fly.
Must Read
The Secret Handshake: Mouse Events
The whole magic act hinges on three little party guests: mousedown, mousemove, and mouseup. Think of them as the “hold,” “wiggle,” and “let go” of the interaction. When you press down on a task bar, your code says, “Hey, I’m grabbing this!”
Then, as you slide your mouse, the code calculates how many pixels you’ve moved and converts that into days or hours, depending on your time scale. It’s like translating your physical hand movement into a language the calendar understands. Finally, when you release, the chart snaps the bar to the nearest day marker, like a fridge magnet finding its spot.
The “Don’t Break Everything” Checklist
Now, before you start flinging bars around like a confetti cannon, you need a few guardrails. First, you’ll want to disable text selection while dragging. There’s nothing worse than trying to move a task and accidentally highlighting the entire project plan instead. It’s like trying to pick one grape out of a fruit salad with a fork—messy.
Second, consider clamping your drag within the chart’s timeline. You don’t want a task bar flying off into the year 2035 just because your mouse twitched. Add a little visual feedback, like a shadow or a color change, so the user knows they’re holding a live grenade—er, a live task.
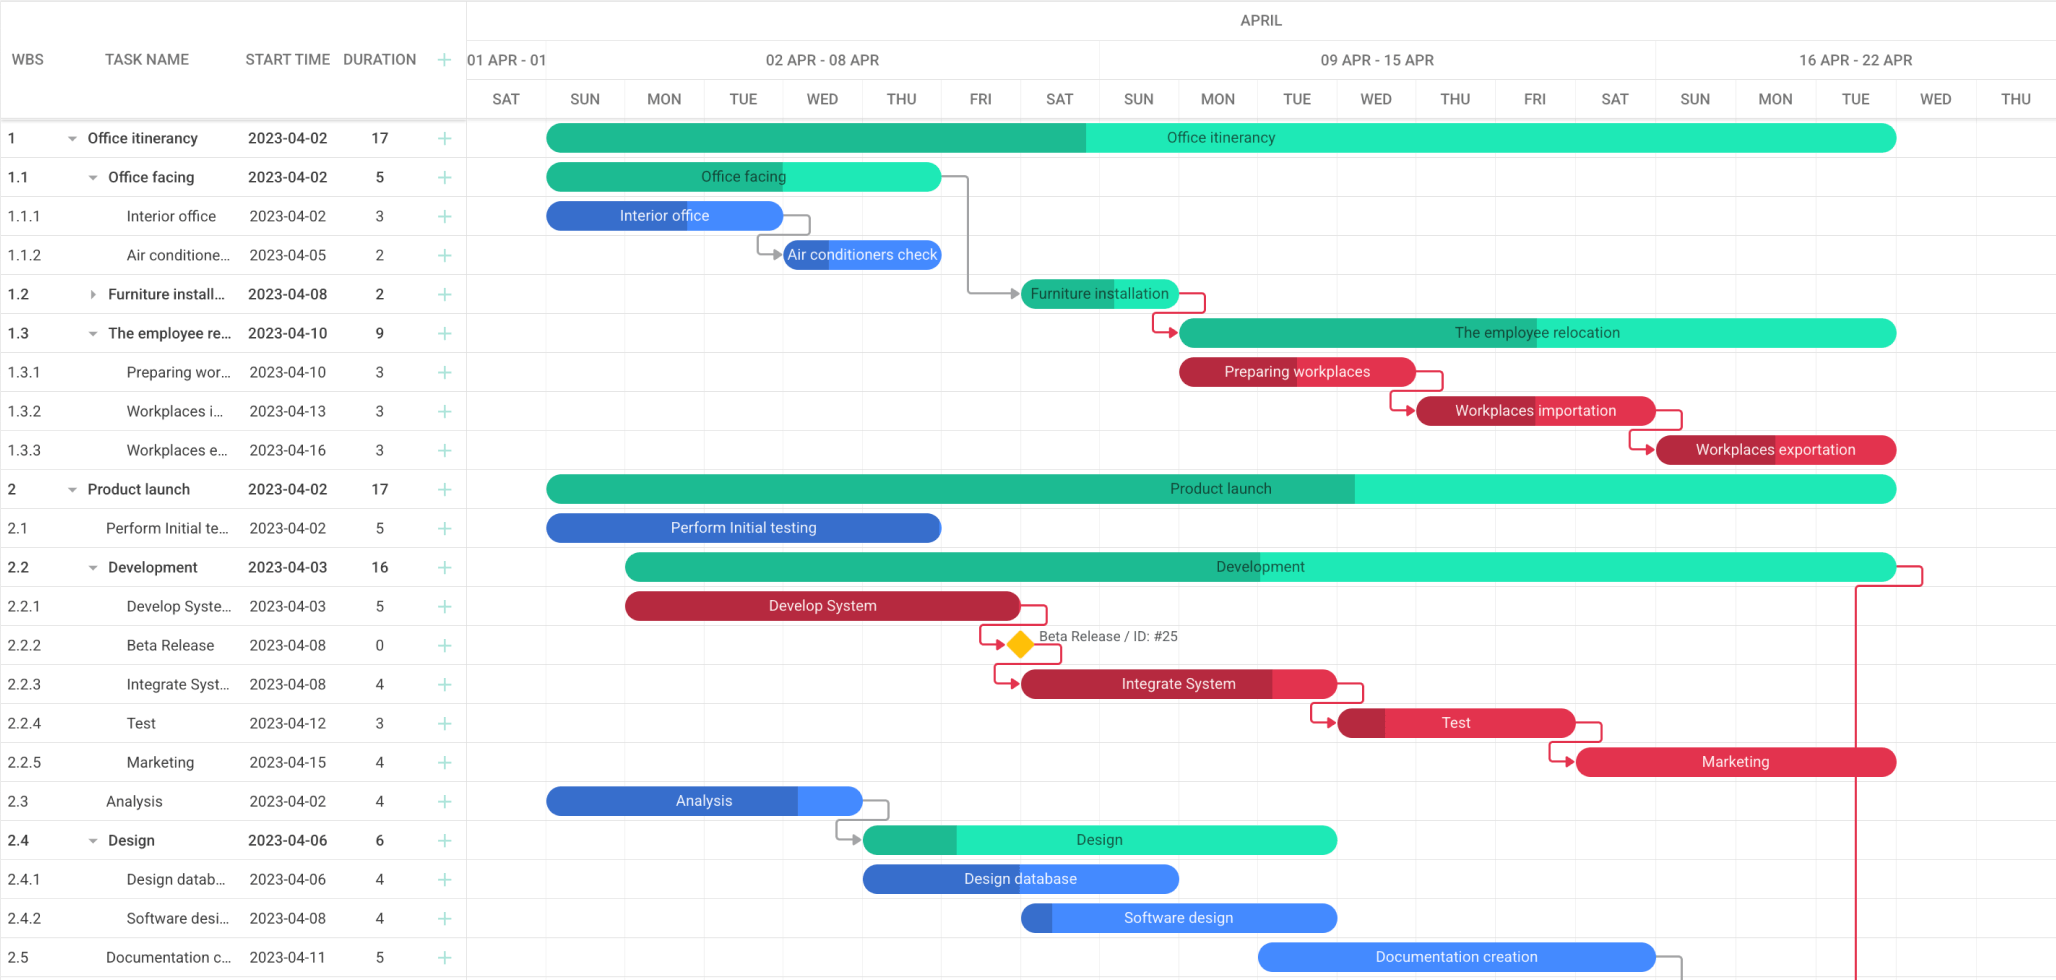
And don’t forget about dependencies. If Task B can’t start until Task A finishes, dragging Task A should either push Task B along with it, or send a polite warning. Otherwise, you’ll have a cascade of broken promises, like dominoes made of wet cardboard.
Libraries: Your Lazy Friend
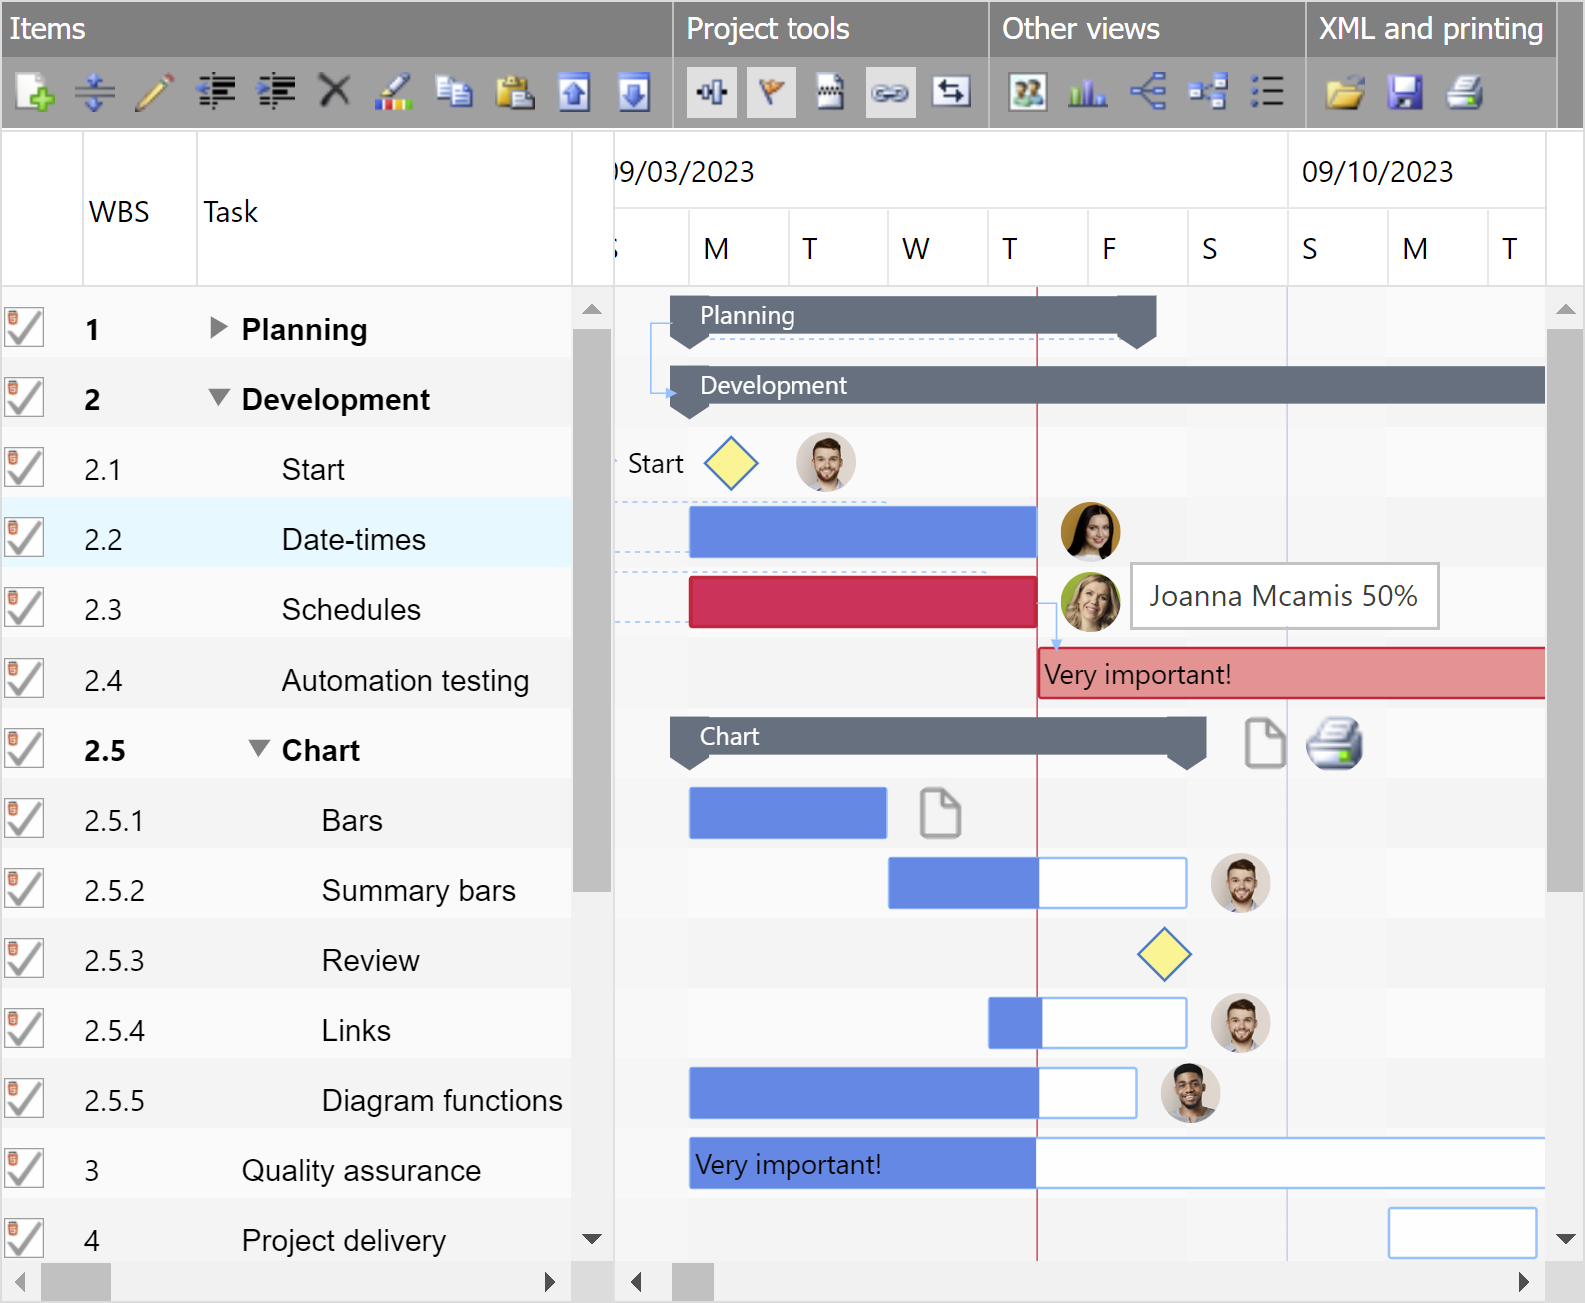
Do you really want to hand-code all this pixel math? Unless you’re a masochist who enjoys debugging at 2 AM, use a library. Options like DhtmlxGantt, Syncfusion, or the open-source Frappe Gantt have all this built-in. You literally write two lines of code, and boom—you’re dragging tasks like a pro gamer.
These libraries handle the annoying edge cases too: touch devices, zoom levels, and the dreaded “drop between two bars” precision. They’re like having a personal trainer for your Gantt chart—they do the heavy lifting while you look good.
But Wait, There’s Confetti!
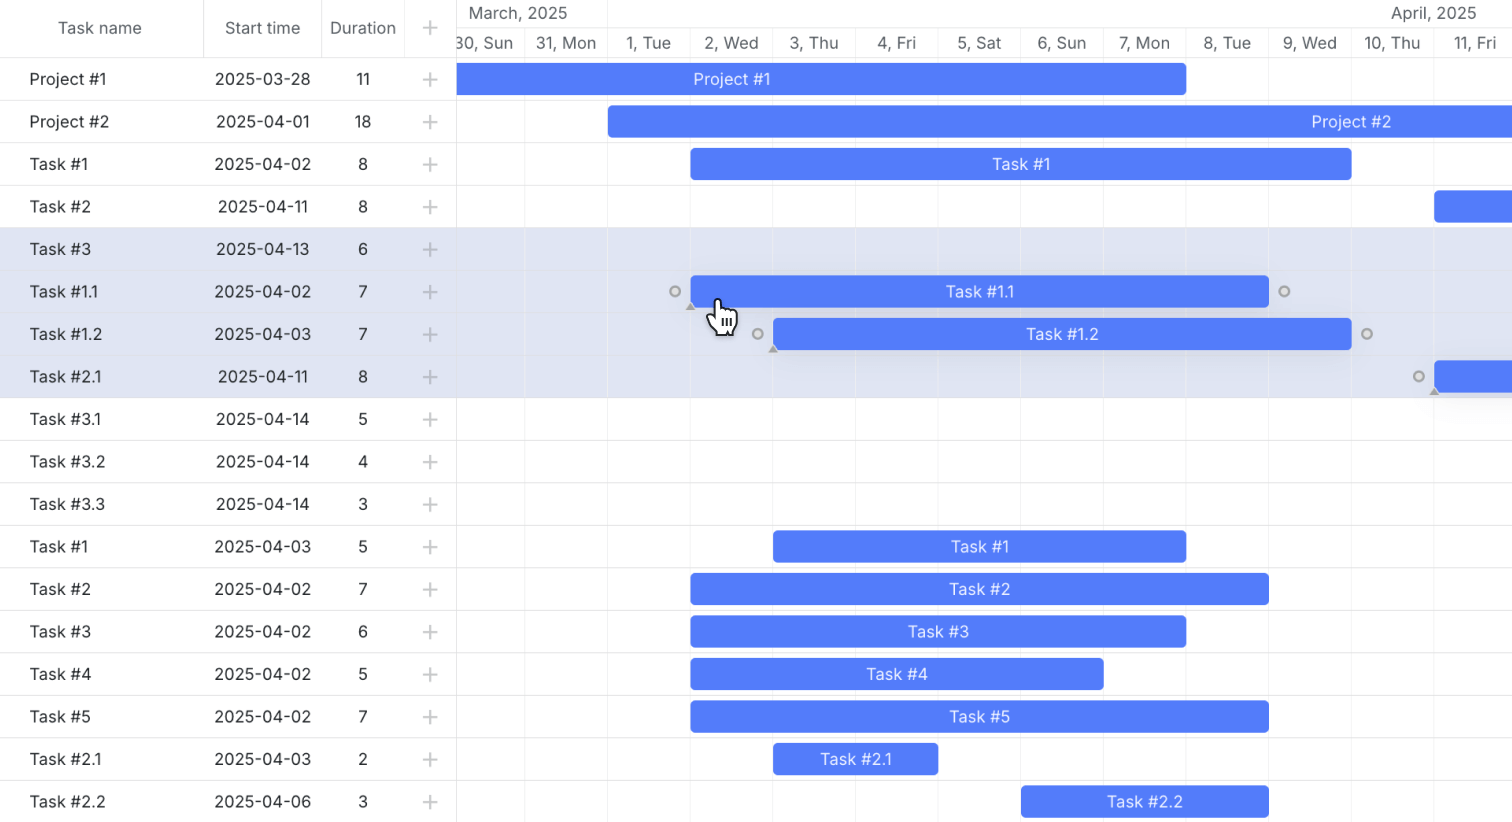
Here’s the fun part: drag-and-drop isn’t just for moving dates left and right. You can also use it to reorder tasks vertically (swap rows) or even to resize a task’s duration by dragging its edges. It’s like having a Swiss Army knife made of timelines. Imagine making a task two days longer by simply pulling its right edge outward—no modal dialogs, no “Are you sure?” prompts. Pure, unadulterated efficiency.
Just remember to add a little animation when the task snaps to its new spot. A subtle bounce or a smooth slide makes the whole thing feel alive. Otherwise, it’s like watching a robot do a dance—technically correct, but lacking soul.
The Real-World Vibes
In a real project, you’ll attach a “change” event to the chart. Every time a drop happens, you’ll fire off an AJAX request to your backend to save the new dates. That way, you’re not just moving pixels; you’re updating reality. And don’t forget to add a loading spinner—because nothing kills the vibe like silent failure.
You might also want to add an “undo” button, because we all make mistakes. Just like that time you accidentally emailed the whole company with a cat meme instead of the quarterly report. Undo is your friend—your very forgiving, non-judgmental friend.
The Grand Takeaway
So there you have it: drag-and-drop in JavaScript Gantt charts is like giving your project plan a superpower. It’s intuitive, it’s fast, and it makes you look like a tech wizard in front of stakeholders. Sure, there’s a learning curve, but once you get past the “why is my mouse sticking?” phase, it’s smooth sailing.
Next time someone says, “Can you move this task to next week?” you won’t sigh or open a spreadsheet. You’ll just grab that little bar, fling it over, and watch the timeline adjust with a satisfying click. And honestly? That’s the kind of small victory that makes the whole day feel brighter. Go forth, drag things, and remember: if the code breaks, just drag the error message into the trash—it works 0% of the time, but it feels great.