Open Interest Indicator Tradingview

Why Watching Open Interest Feels Like Having X-Ray Vision
Imagine peeking behind the curtain of a trading chart to see exactly what the big players are doing. That’s the superpower that the Open Interest Indicator on TradingView gives you. It’s not just about price lines; it’s about the fuel behind the move, and once you understand it, you’ll never look at a market the same way again.
Open Interest (OI) tells you the total number of active derivative contracts—futures or options—that haven’t been closed out yet. Unlike volume, which counts every trade, OI counts the open positions that are still alive. Think of it as a stadium’s crowd size: price tells you what the score is, but OI tells you how many fans are still in their seats.
What This Magic Number Actually Does
The core purpose of OI is to confirm whether a price trend is healthy or about to collapse. When price goes up and OI is also rising, new money is pouring in, which means the rally has real muscle. Conversely, if price rises but OI is falling, that’s often a warning sign—the move is driven by short-sellers covering, not by fresh buying pressure.
Must Read
On TradingView, the indicator is a clean line at the bottom of your chart, usually colored to show increases and decreases. With a single toggle, you can overlay it on any futures or crypto chart, making professional-grade analysis feel like a casual game. It’s especially popular with crypto traders because Bitcoin’s OI numbers are constantly shared on social media as a major sentiment gauge.
Pro tip: When OI hits an extreme high while price stalls, it’s often a signal of an impending explosion—either up or down—because too many leveraged traders are crowded on one side.
Why You Should Care (Even as a Beginner)
You don’t need a finance degree to use OI; you just need to watch its relationship with price. For example, if you see a sharp price drop with OI shooting up, that means new short sellers are aggressively entering—so the downtrend might have legs. If you see a price drop with OI falling, it’s likely just profit-taking, and the trend may resume soon.
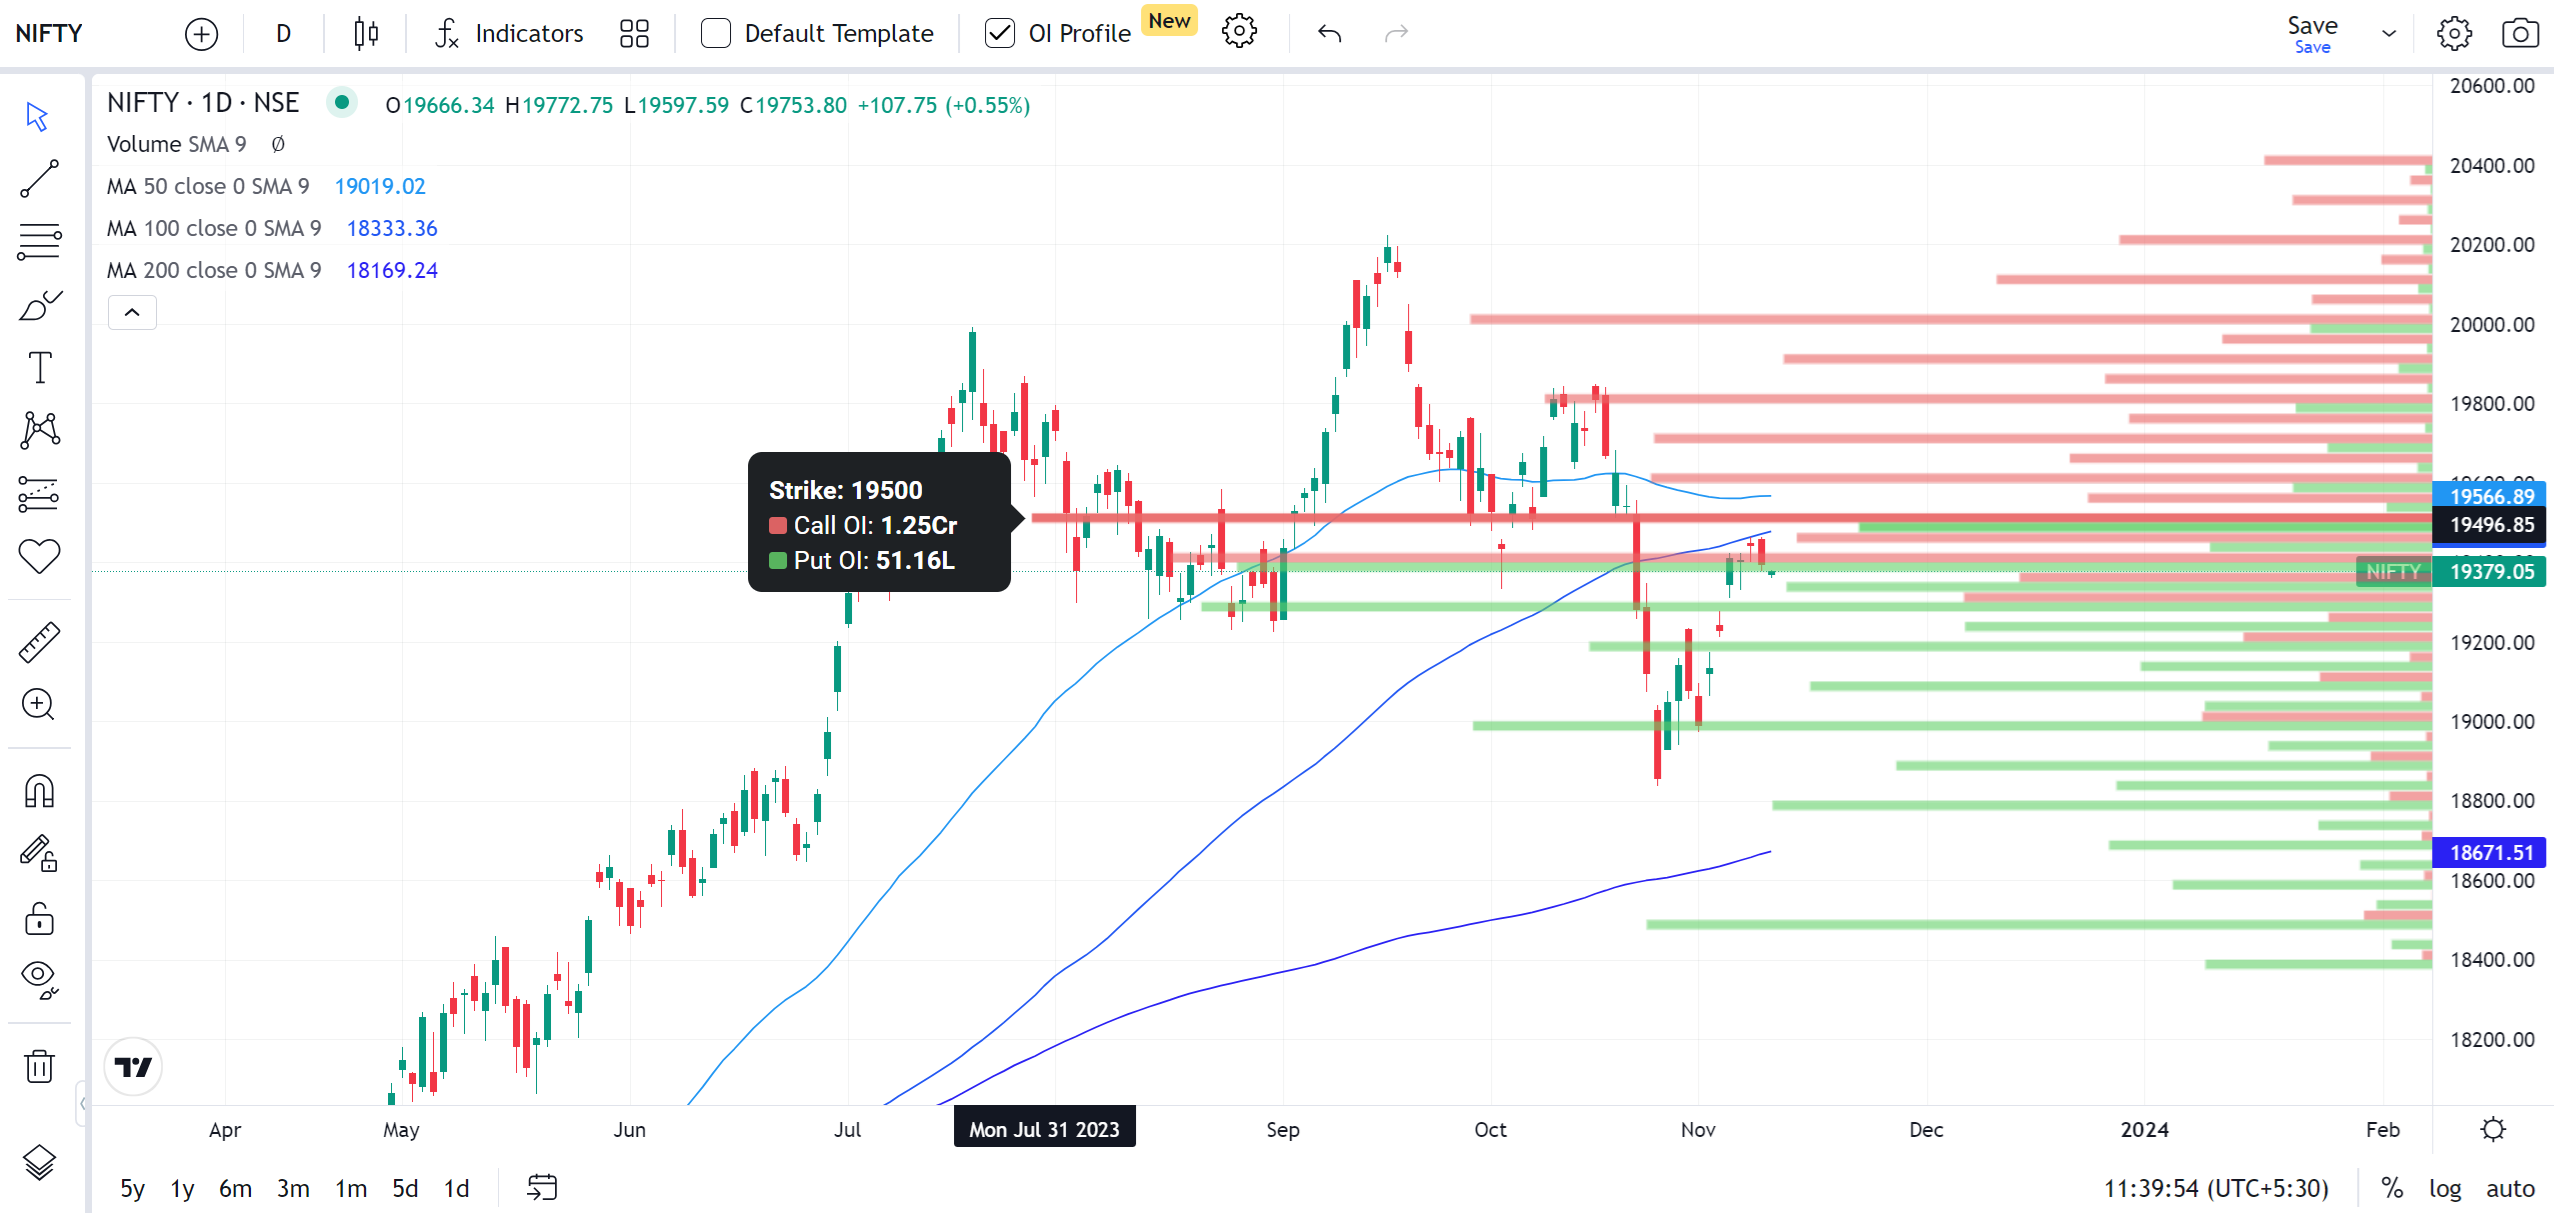
This indicator also helps you avoid fake breakouts. A breakout above a resistance level with high OI is a convincing move. The same breakout with low OI is often a trap, luring in retail buyers before reversing. By watching OI on TradingView, you get a second opinion on every signal from moving averages or RSI.
How to Use It on TradingView Like a Pro
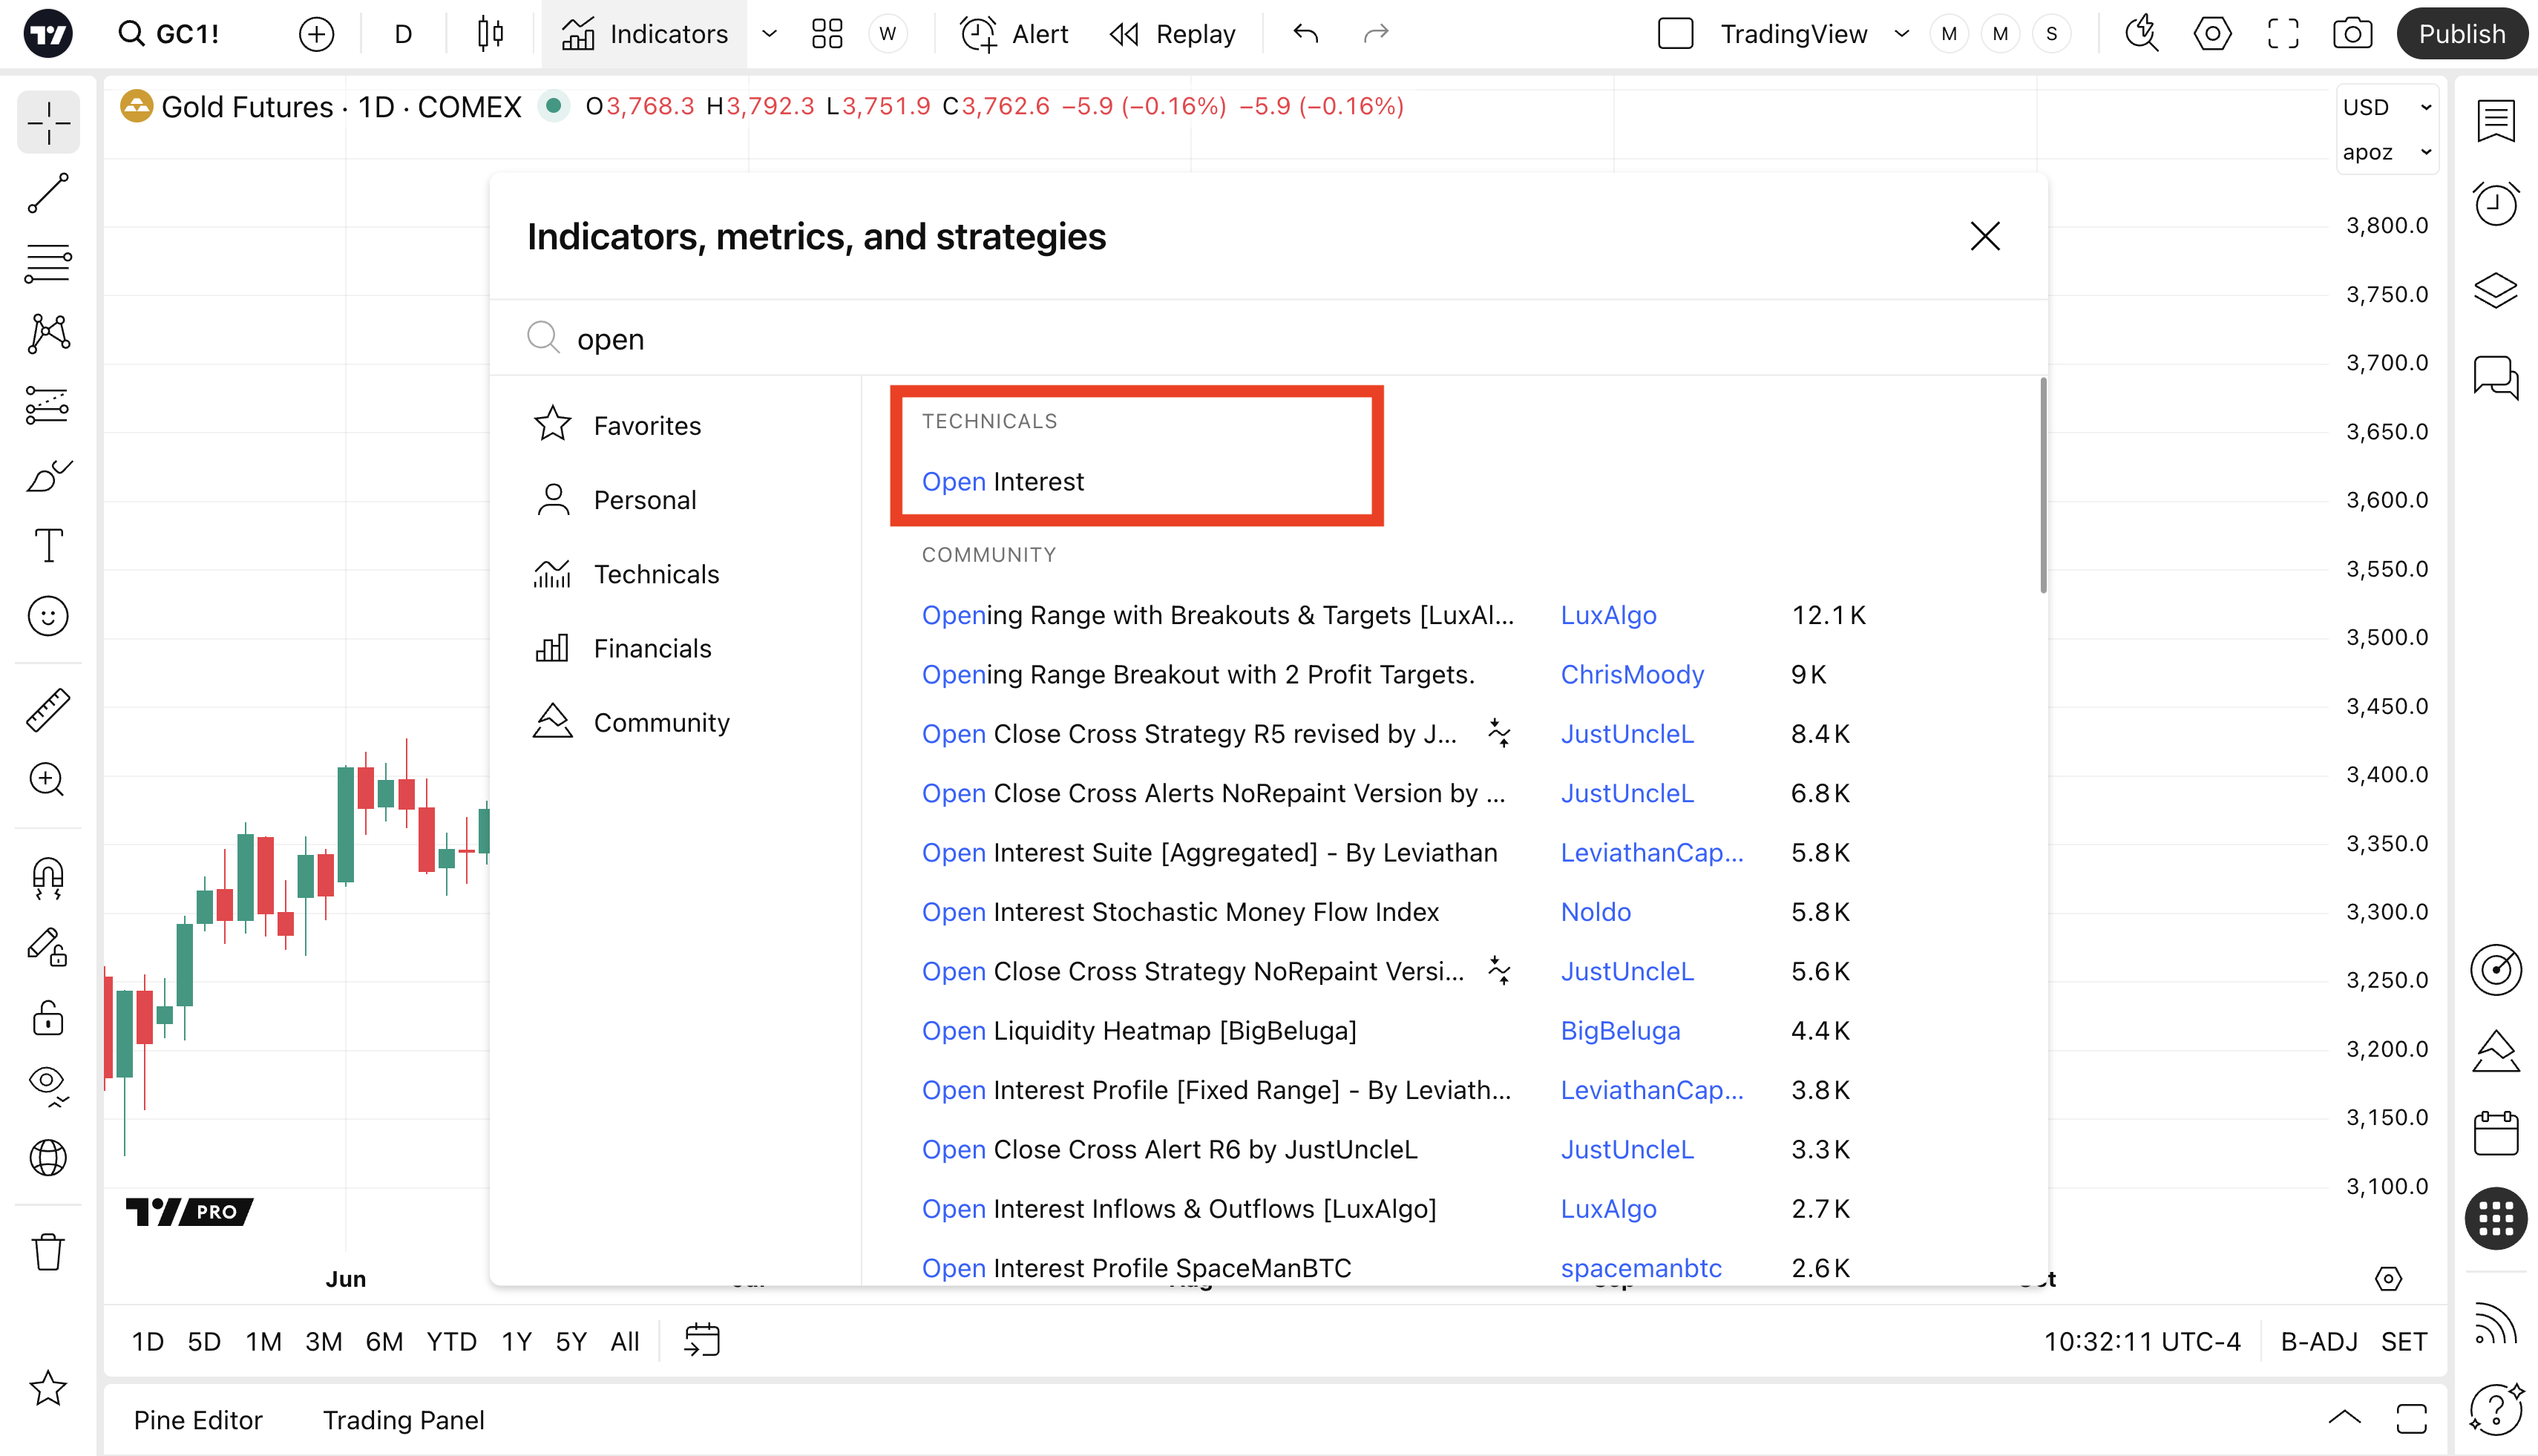
First, open any chart and type “Open Interest” into the indicators search bar. You’ll see multiple versions—some show raw numbers, others show percentage changes. Start with the default one to see the raw, unpolished truth, then experiment with the smoothed versions to reduce noise.

Combine OI with price action and a simple volume bar. The classic recipe: rising price + rising volume + rising OI = strong trend. Falling price + rising volume + falling OI = weak trend, likely a correction. It’s a three-part harmony that filters out most of the market’s lies.
Don’t forget to use the timeframe multiplier. A daily OI view shows the big picture, but a 15-minute OI view can show short-term squeezes. Try switching between them to find which pace matches your trading style, whether you’re a day trader or a swing trader.

The Fun Part: Predicting Squeezes
One of the most thrilling uses of OI is spotting a short squeeze or a long squeeze. When OI is extremely high and price starts moving against that crowded side, the forced liquidations cause violent, fast moves. Watching this on TradingView live feels like watching a fireworks show that you timed perfectly.
Finally, remember that OI is not a crystal ball—it’s a risk management tool. It tells you when to hold on tight and when to run for the exits. So next time you open a chart, turn on the Open Interest indicator and watch the crowd inside your screen. You’ll feel like the smartest person in the room, even if you’re just trading from your couch.
Happy trading, and may your OI always trend in your favor.